Kuona CI analysis
The first goal for Kuona is to collect data about CI server activity and chart it in a way that can provide insight into the effectiveness of the system.
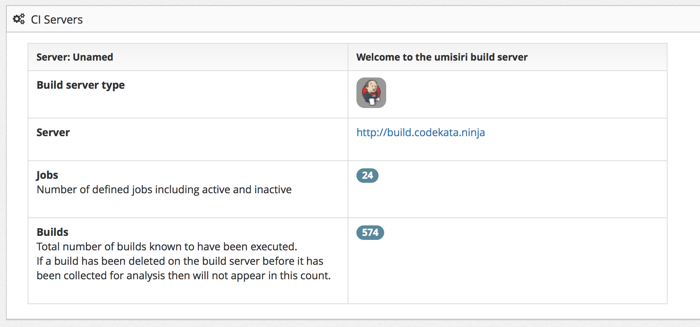
Here are some example screen shots from my Jenkins CI server that I use for personal projects.
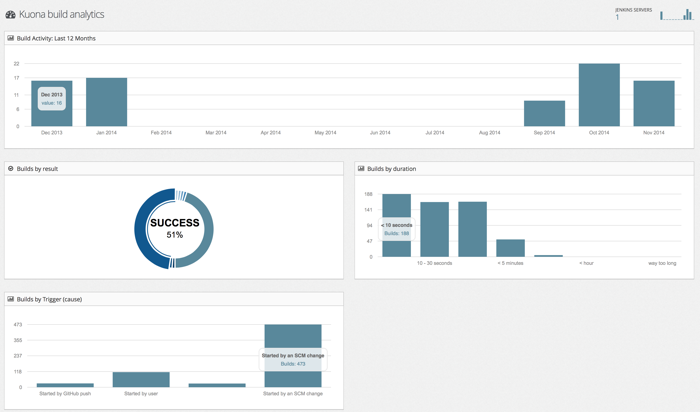
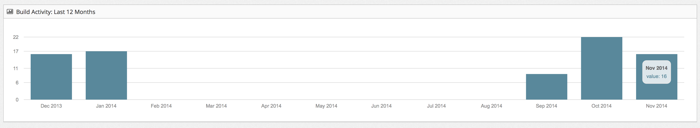
First off the activity chart - shows the number of builds per month for the last year.
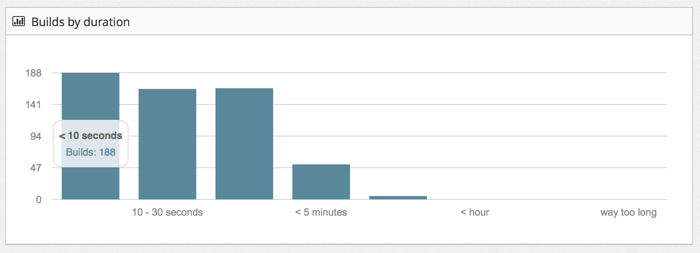
Short builds are important to make sure the feedback is delivered quickly…
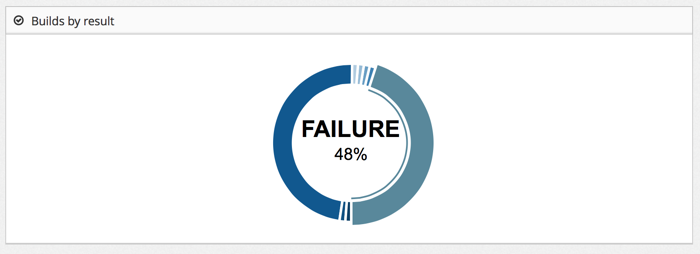
Build outcomes. Success and failure are useful. A high proportion of failures or successes might indicate a problem.
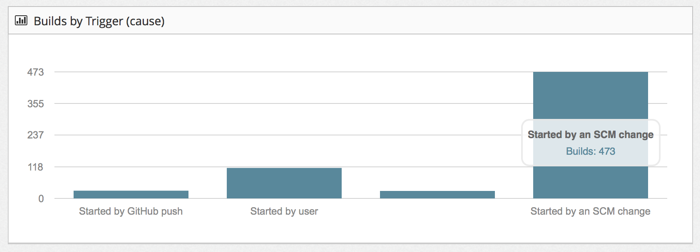
What caused the builds
And finally where the data came from