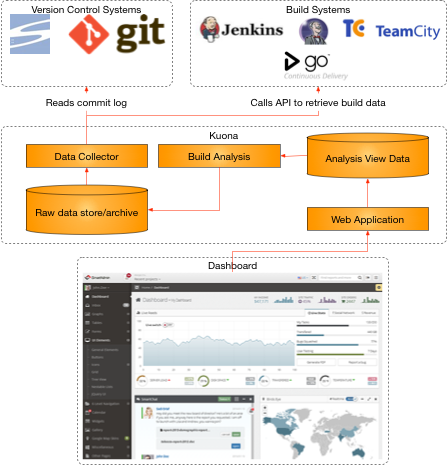
Kuona takes a ‘big data’ approach to capturing and analyzing
data. Current targets are build, continuous integration servers and
version control system logs. The collected data is stored locally
probably on the file-system with some sort of index files. Taking a
copy means that the later stages of analysis and presentation can
continue without collection.
The Analysis system reads the collected data and produces view ready
data for the web application to consume.
The web app makes the view data available to the end user.
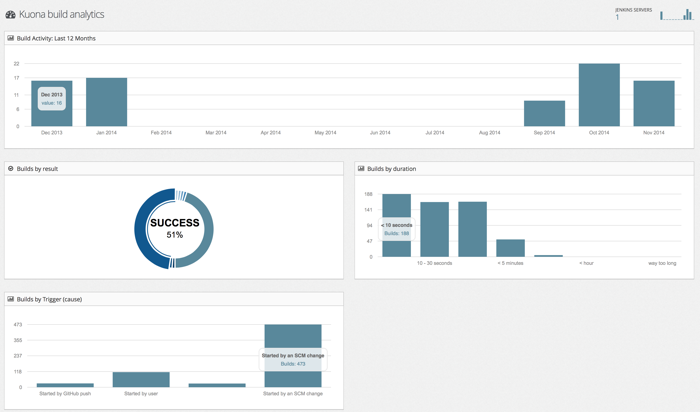
The dashboard shown in the diagram is not real and needs a lot of
design. The analysis is expected to include judgments on the collected
data. For example initial build feedback times of more that 10 minutes
might be considered bad and would then score against the overall
health of the system. Applying lean value stream analysis to the
collected data provides some insight into the efficiency of the
delivery system. A low efficiency value might indicate that more
resources for the build systems is required.
Drilling a little deeper
Data Collection
Each build and version control systems exposes data in a different
way. The collector is responsible for accommodating the communication
differences but not in manipulating the returned data. This approach
preserves the collected data and makes the analysis system responsible
for interpretation. The collection system collects system meta data
that provides hints to the analysis and allows analyzers to adapt
their processing based on system version etc.
By separating collection and analysis adding a new analysis process or
view data requirement does not require re-collection of
data. Particularly important for long running systems where the
original data source may no longer be available.
Data analysis
These processes read the collected data to produce data that is ready
for viewing. This might include collecting time series data on the
number of builds for each day of the week, month or year. Calculating
the ratio between production and test code that has been added to the
repository etc.
Initially the analysis will be part of the Kuona application. Longer
term this may be extracted to allow customization and new analyses to
be added.
Web application
The web application is responsible for combining the collected data
with view templates. It is not currently clear at the moment if this
combination should be performed server or client side.
Design principles - developer guidelines
-
Kuona is made available as a single Java JAR file that is capable of
all the functions. This approach makes it easier for people to
evaluate the application.
-
Kuona should be extensible and customisable to allow organizations to
add their own logo and styling.
-
The application should minimize the number of external dependencies
and any dependencies it does have should be actively managed under
version control.